FlashRev New Weekly Update [11th November 2024 - 16th November 2024]
FlashRev Discover
【FlashInfo PC】
-
CRM, salesforce dynamic list partial push bug and adjustment of engage service timeout
-
Under Discover, optimized the anti-crawling logic for Lead search and Lead detail query to reduce instances of mistakenly blocking user usage.
-
Under CRM, a single Salesforce account can now be linked to multiple distinct FlashRev Organization accounts.


-
In the CRM List under the List tab, a new feature has been added to the Salesforce dynamic list. This feature provides support for editing the previously bound dialer shortcut owner configuration list.


-
Under the List tab -> List Management -> CRM List, users can filter the specific CRM List items by searching for an email or person name.


-
Under the List tab - List Management - CRM List, users can manage the Mailboxes pool when creating a Salesforce Dynamic List, choosing which SDRs' mailboxes to use to send emails to customers.


-
In the CRM tab under the CRM Enrichment sub-tab, users can now bind the same Salesforce account to different FlashRev accounts, enabling the management of multiple accounts for different customers on the FlashRev platform.
-
Under the Intent tab and Company Profile sub tab, we have an enhanced feature which uses massive historical data for syntactic retrieval when the user types in Topic Intent Keywords, thereby increasing the number of potential leads for the intended company.
-
Under the CRM tab, in the People Profile sub-tab, when users input Social Intent Keywords, data is collected from the broad network, which combined with massive historical data for grammar retrieval, increases the potential intention of People's leads.
-
Set the Most Popular package recommendation to the '5 Reports' package in the package pop-up interface.

-
Fix the issue where the pop-up could not be triggered in the Book a Demo package interface.


-
People Profile" under, Optimized the default search type of the detail interface, the default search for people details in English

-
Under the People Profile, fixed the issue where spaces " " couldn't be entered in the search box on the details page.
-
Optimized the click jump logic for the "Get Started For Free" and "View Pricing Plan" buttons.
-
Optimization of UI display when some modules have no data, showing 'No data' icon and text.
-
Fixed the data query issue of Similar Companies in the company details page.
-
Add FlashAI Voice Agent demo page


FlashRev Engage
Date: 2024-11-11 - 2024-11-16
1、New Performance Analytics Wallboard
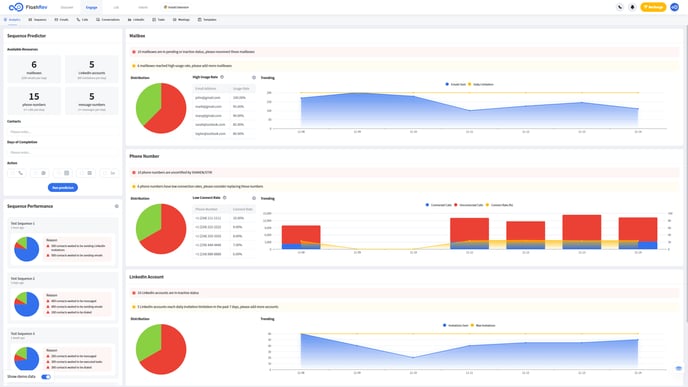
We are excited to announce the launch of the Performance Analytics Wallboard in this week’s update! This powerful new feature is designed for enterprise owners and administrators, providing quick and easy access to critical data for better decision-making and resource management.

The Performance Analytics Dashboard allows admins/owners to:
-
Identify Unavailable Resources: Quickly see which mailboxes, phone numbers, and LinkedIn accounts are currently unavailable, enabling faster resolution and improved operational efficiency.
-
Monitor High Utilization: Track which mailboxes, phone numbers, and LinkedIn accounts are being highly utilized, helping you optimize resource allocation and identify potential areas for improvement.
-
Review Outgoing Data: Access a comprehensive view of your organization’s outgoing mail and phone data over the past 7 days, along with LinkedIn statistics. This insight helps you assess overall performance and effectiveness.
-
Evaluate Sequence Progress: Identify which sequences are not progressing as expected, allowing you to take timely action to enhance performance and achieve your goals.
-
Utilize the Sequence Predictor: Leverage the sequence predictor tool to estimate the expected time for creating a new sequence based on current available resources. This feature aids in planning and resource management for future campaigns.
#Sequence Predictor
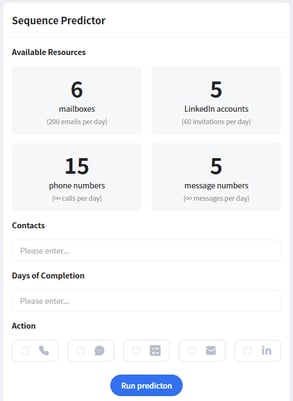
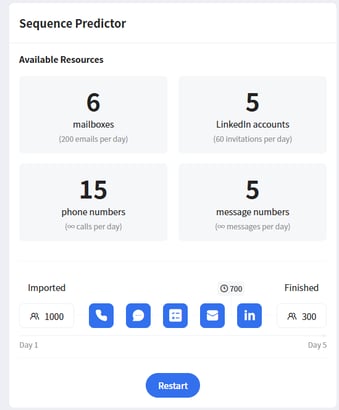
In the Sequence Predictor, users can see how many resources are currently available (including mailboxes, LinkedIn accounts, phone numbers, and SMS numbers), as well as the maximum number of these resources that can be sent per day (how many emails, how many calls, how many messages, and how many LinkedIn invitations can be sent), and by entering the expected number of contacts that will be executed, the expected period of time, and the number of contacts that are expected to be sent, the expected period of time, and the expected period of time that the user will be able to send. Predict the number of contacts and bottlenecks that will be completed by entering the expected number of contacts, the expected cycle time, and what types of execution steps you want.


#Sequence Performance
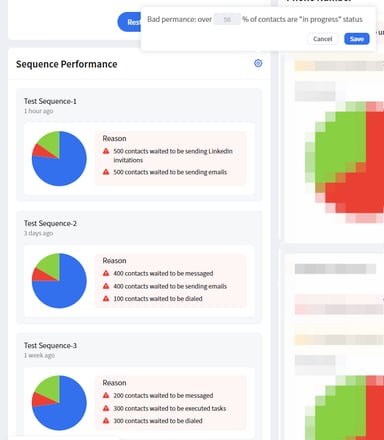
In Sequence Performance, users can set a threshold to filter out sequences that are relatively lagging behind in progress according to their preferences (for example, I set the threshold to 50%, which means that if greater than or equal to 50% of the contacts in a Sequence are in IN PROGRESS, that Sequence will be filtered out) and, by looking at the “Reason”, they can quickly find out what resources are not sufficient (e.g. mailboxes) or what steps that need to be performed by humans are not being executed on time (e.g. tasks) that are causing the Sequence to lag in execution.

#Mailbox
In the Mailbox module, users can view the distribution of mailbox statuses (how many mailboxes are available and how many are unavailable), and they can filter which mailboxes have been in high utilization over the past 7 days by setting a threshold (for example, if a user sets the threshold to 50%, it means that if a mailbox is more than 50% utilized on any of the past 7 days, that mailbox will appear in the “high usage rate” list), you can see the trend of sending emails of the whole enterprise in the past 7 days and the corresponding upper limit of sending quantity.

#Phone Number
In the Phone module, users can view the distribution of phone number authentication status (how many numbers have been authenticated by SHAKEN/STIR and how many numbers have not been authenticated by SHAKEN/STIR), filter which phone numbers have a low usage rate in the past 7 days by setting a threshold (e.g., if users set the threshold to 10%, it means that if the call connect rate of a phone number is less than 10% in the past 7 days, this number will appear in the “low connect rate” list), user can also see the trend of the number of outbound calls, the number of calls answered and the answer rate of the whole enterprise in the past 7 days.

#LinkedIn
In the LinkedIn Accounts module, users can view the distribution of LinkedIn accounts (how many are available and how many are unavailable), and can view the trend and number of LinkedIn invitations sent across the organization over the past 7 days and whether the cap has been reached.
